跳到主要内容

方法和指标和工具✅

如何做性能优化的?

答案
  1. 评估阶段 (Assess) 确定关键指标体系, 注意评估的指标和方式需要结合真实的业务场景,分析关键链路,具体可以参考 以用户为中心的效果指标 常见的评估指标如下

    指标类型核心指标业务价值优先级
    加载性能LCP、FCP首次体验P0
    交互性能FID/INP、TTI用户操作响应P0
    视觉稳定性CLS视觉体验P1
    基础性能TTFB、资源加载时间技术基础P2
  2. 收集阶段 (Collect) 通过埋点等手段进行用户端性能数据的收集,常用的工具包括 web-vitalssentry 等。

  3. 分析阶段 (Analyze) 通过真实的用户数据进行性能分析,识别性能瓶颈。

  4. 验证阶段 (Validate), 采用 AB 验证,或者实验手段验证效果,重复上述流程进行持续优化。

  5. 标准化和自动化,将性能优化的流程和指标标准化,形成自动化的监控和预警机制。重复上述 1-5 的流程

延伸阅读

常用性能指标

答案
指标名称描述
TTFB(Time to First Byte)首字节时间,指浏览器发起请求到接收到第一个字节的时间。
FCP(First Contentful Paint)首次内容绘制,指浏览器开始渲染页面内容的时间点。
LCP(Largest Contentful Paint)最大内容绘制,指页面上最大的可见内容元素被渲染的时间点。
INP(Interaction to Next Paint)交互到下一个绘制,指用户交互后页面更新的时间点。
FID(First Input Delay)首次输入延迟,指用户首次与页面交互到浏览器实际开始处理交互事件的时间间隔。
TTI(Time to Interactive)可交互时间,指页面完全加载并且可以响应用户交互的时间点。
TBT(Total Blocking Time)总阻塞时间,指在页面加载过程中,主线程被阻塞的总时间。
CLS(Cumulative Layout Shift)累积布局偏移,指页面内容在加载
提示

性能指标并不是一成不变的,它们需要根据具体的业务场景进行定义和调整。比如在电商网站中,LCP 可能更关注商品图片的加载时间,而在新闻网站中,FCP 可能更关注文章内容的加载时间。此外还有诸如卡顿率、秒开率等指标。

延伸阅读

有哪些前端性能分析工具

答案
工具类型工具名称主要功能适用场景
浏览器开发者工具Chrome DevToolsPerformance面板分析CPU使用率、内存占用、网络请求;Network面板查看请求耗时;Lighthouse审计性能、可访问性开发调试、实时性能分析
Firefox Developer Tools性能分析、网络监测开发调试
在线性能监测平台WebPageTest多地点性能测试,提供FCP、LCP、FID等指标,生成可视化报告全面性能测试、定期监控
Pingdom Tools测试网站性能和可用性,提供优化建议快速性能检查
性能监控工具Google Analytics页面加载时间、用户行为数据用户体验分析
New Relic Browser全面前端性能监控,实时跟踪用户交互生产环境监控
代码分析工具Lighthouse CI集成到CI流程,自动化性能审计持续集成
PageSpeed Insights APIAPI方式获取性能分析结果自动化监控
专业分析工具web-vitals收集Web Vitals指标核心指标监控
sentry性能监控和错误追踪全栈监控

分类说明

  • 开发阶段 主要使用浏览器开发者工具进行实时调试和分析
  • 测试阶段 使用在线监测平台进行全面的性能测试
  • 生产阶段 部署性能监控工具进行持续监控和告警
  • 自动化 集成代码分析工具到CI/CD流程中
提示

建议采用多层次的性能分析策略:开发时用Chrome DevTools,测试时用WebPageTest,生产环境部署专门的监控工具如Sentry,并在CI中集成Lighthouse进行自动化检查。

延伸阅读

说一下 Performance API

答案

Performance API 是浏览器提供的性能测量接口,用于监控和分析网页性能。

核心接口功能代码示例
performance.timing页面导航时间点timing.loadEventEnd - timing.navigationStart
performance.now()高精度时间戳const start = performance.now()
performance.getEntries()获取性能条目performance.getEntriesByType('resource')
PerformanceObserver实时性能监听observer.observe({ entryTypes: ['longtask'] })

主要应用场景

场景实现方式关键指标
页面加载监测performance.timing首屏时间、白屏时间
资源加载分析getEntriesByType('resource')资源耗时、加载瀑布
用户交互响应performance.now()点击响应时间
Long Task 监控PerformanceObserver阻塞时间、卡顿检测
自定义测量mark() + measure()业务流程耗时

核心代码示例

// 监听长任务
const observer = new PerformanceObserver(list => {
list.getEntries().forEach(entry => {
console.log(`Long task: ${entry.duration}ms`)
})
})
observer.observe({ entryTypes: ['longtask'] })

// 自定义性能标记
performance.mark('operation-start')
// 执行操作
performance.mark('operation-end')
performance.measure('operation', 'operation-start', 'operation-end')

实际开发要点

  • 优先使用 PerformanceObserver 而非轮询,减少性能开销
  • performance.timing 已废弃,新项目使用 Navigation Timing Level 2
  • 跨域资源需服务器设置 Timing-Allow-Origin
  • 及时清理性能条目缓冲区避免内存泄漏

参考资料

说一下什么是 FCP?

答案

首次内容渲染 (FCP) 衡量从用户首次导航到网页到网页任何一部分内容呈现在屏幕上的时间。对于此指标,“内容”是指文本、图片(包括背景图片)、<svg> 元素或非白色 <canvas> 元素。

网站应尽量将首次有意义的绘制时间控制在 1.8 秒或更短的时间。为确保大多数用户都能达到此目标值,一个合适的衡量阈值是网页加载时间的第 75 个百分位数,并按移动设备和桌面设备进行细分。Lighthouse 将 FCP 视为一个重要的性能指标,并将其纳入其性能评分中。具体详见 FCP

FCP 的测量可以采用

<!DOCTYPE html>
<html lang="zh-CN">
<head>
   <meta charset="UTF-8">
   <title>捕获 FCP 示例</title>
</head>
<body>
   <h1>捕获 FCP(First Contentful Paint)示例</h1>
   <script>
      // 使用 PerformanceObserver 监听 FCP
      if ('PerformanceObserver' in window) {
         const observer = new PerformanceObserver((list) => {
            for (const entry of list.getEntries()) {
               if (entry.name === 'first-contentful-paint') {
                  // FCP 时间以毫秒为单位
                  console.log('FCP 时间:', entry.startTime.toFixed(2) + ' ms');
               }
            }
         });
         observer.observe({ type: 'paint', buffered: true });
      }
   </script>
</body>
</html>

延伸阅读

FP、FCP 有什么区别和白屏时间有什么关系?

答案
指标全称定义触发条件
FPFirst Paint首次绘制浏览器首次绘制任何像素到屏幕上
FCPFirst Contentful Paint首次内容绘制浏览器首次绘制来自DOM的内容(文本、图片、SVG等)
白屏时间White Screen Time白屏持续时间从页面开始加载到首次有内容显示

时间关系图示

导航开始 → 白屏阶段 → FP → FCP → 页面可交互
| | | | |
| | | | └─ 用户可以看到有意义的内容
| | | └─ 首次内容绘制
| | └─ 首次绘制(可能是背景色、边框等)
| └─ 用户看到的是白屏
└─ performance.timing.navigationStart
提示

注意白屏时间并不是一个严格的技术指标,而是用户体验的感知。从简化处理方面可以近似认为 FP 时间就是白屏时间,但是从用户视角可能没加载出来具体内容也被认为白屏,此时需要根据具体的场景去定义白屏时间的计算方式。

代码测量示例

// 监听 paint 事件
const observer = new PerformanceObserver(list => {
list.getEntries().forEach(entry => {
if (entry.name === 'first-paint') {
console.log(`FP: ${entry.startTime}ms`)
}
if (entry.name === 'first-contentful-paint') {
console.log(`FCP: ${entry.startTime}ms`)
console.log(`白屏时间: ${entry.startTime}ms`)
}
})
})
observer.observe({ entryTypes: ['paint'] })
提示

在优化时,FCP 比 FP 更重要,因为它代表用户真正看到内容的时刻。通过优化关键渲染路径可以同时改善这两个指标。

延伸阅读

如何统计资源加载耗时?

答案

资源加载耗时统计通过 Performance API 的 Resource Timing 接口实现,可以监控所有静态资源的加载性能。

核心监控方法

方法功能
performance.getEntriesByType('navigation')用于衡量 HTML 文档请求(即导航请求)的速度
performance.getEntriesByType('resource')例如 CSS、JavaScript、图片和其他资源类型
fetch/xhr手动统计网络请求耗时
<!DOCTYPE html>
<html lang="zh">
<head>
   <meta charset="UTF-8">
   <meta name="viewport" content="width=device-width, initial-scale=1.0">
   <title>资源加载性能监控</title>
   <style>
      body {
         font-family: Arial, sans-serif;
         max-width: 1200px;
         margin: 0 auto;
         padding: 20px;
      }
      .dashboard {
         display: flex;
         flex-wrap: wrap;
         gap: 20px;
         margin-bottom: 30px;
      }
      .card {
         flex: 1;
         min-width: 300px;
         padding: 15px;
         border-radius: 8px;
         box-shadow: 0 2px 4px rgba(0,0,0,0.1);
         background: #f9f9f9;
      }
      table {
         width: 100%;
         border-collapse: collapse;
         table-layout: fixed; /* 固定表格布局以控制列宽 */
      }
      th, td {
         padding: 8px;
         border-bottom: 1px solid #ddd;
         text-align: left;
         overflow: hidden;
         text-overflow: ellipsis; /* 文本溢出显示省略号 */
         white-space: nowrap; /* 防止内容换行 */
      }
      th {
         background-color: #f2f2f2;
      }
      .slow {
         color: #d32f2f;
      }
      .moderate {
         color: #f57c00;
      }
      .good {
         color: #388e3c;
      }
      .resource-list {
         height: 400px;
         overflow-y: auto;
      }
      /* 为不同列设置合适的宽度 */
      #resourceTable th:nth-child(1), 
      #resourceTable td:nth-child(1) {
         width: 25%;
      }
      #resourceTable th:nth-child(2), 
      #resourceTable td:nth-child(2) {
         width: 10%;
      }
      #resourceTable th:nth-child(3), 
      #resourceTable td:nth-child(3) {
         width: 15%;
      }
      #resourceTable th:nth-child(4), 
      #resourceTable td:nth-child(4) {
         width: 15%;
      }
      #resourceTable th:nth-child(5), 
      #resourceTable td:nth-child(5) {
         width: 35%;
      }
      /* 确保时间线容器自适应 */
      .timeline-container {
         width: 100%;
         height: 10px;
         background: #eee;
         position: relative;
      }
      /* 添加工具提示样式 */
      td [title] {
         cursor: help;
      }
   </style>
</head>
<body>
   <h1>资源加载性能监控</h1>
   
   <!-- 资源加载仪表盘 -->
   <div class="dashboard">
      <div class="card">
         <h2>资源概要</h2>
         <div id="summary">加载中...</div>
      </div>
      <div class="card">
         <h2>资源类型</h2>
         <div id="typeSummary">加载中...</div>
      </div>
   </div>

   <div class="card resource-list">
      <h2>资源详情</h2>
      <table id="resourceTable">
         <thead>
            <tr>
               <th>名称</th>
               <th>类型</th>
               <th>大小 (KB)</th>
               <th>加载时间 (毫秒)</th>
               <th>时间线</th>
            </tr>
         </thead>
         <tbody>
            <!-- 资源条目将在这里添加 -->
         </tbody>
      </table>
   </div>

   <!-- 加载各种资源类型来演示监控 -->
   <div style="display: none;">
      <!-- 图片 -->
      <img src="https://picsum.photos/200/300" alt="测试图片 1">
      <img src="https://picsum.photos/300/200" alt="测试图片 2">
      
      <!-- 外部样式表 -->
      <link rel="stylesheet" href="https://cdn.jsdelivr.net/npm/bootstrap@5.3.0/dist/css/bootstrap.min.css">
      
      <!-- 外部脚本 -->
      <script src="https://cdn.jsdelivr.net/npm/lodash@4.17.21/lodash.min.js"></script>
      
      <!-- 加载字体 -->
      <link href="https://fonts.googleapis.com/css2?family=Roboto:wght@400;700&display=swap" rel="stylesheet">
   </div>
   
   <script>
      class ResourceMonitor {
         constructor() {
            this.resources = new Map();
            this.init();
         }

         init() {
            // 监控所有资源加载
            const observer = new PerformanceObserver(list => {
               list.getEntries().forEach(entry => {
                  if (this.isStaticResource(entry)) {
                     this.analyzeResource(entry);
                     this.updateUI();
                  }
               });
            });
            
            observer.observe({ entryTypes: ['resource'] });

            // 处理在观察器初始化之前已加载的资源
            performance.getEntriesByType('resource').forEach(entry => {
               if (this.isStaticResource(entry)) {
                  this.analyzeResource(entry);
               }
            });

            this.updateUI();
         }

         isStaticResource(entry) {
            const staticTypes = ['img', 'script', 'css', 'link', 'font'];
            return staticTypes.includes(entry.initiatorType);
         }

         analyzeResource(entry) {
            const analysis = {
               name: entry.name.split('/').pop(), // 只获取文件名
               fullUrl: entry.name,
               type: entry.initiatorType,
               // 时间分析
               dns: entry.domainLookupEnd - entry.domainLookupStart,
               tcp: entry.connectEnd - entry.connectStart,
               ssl: entry.secureConnectionStart > 0 ? (entry.connectEnd - entry.secureConnectionStart) : 0,
               ttfb: entry.responseStart - entry.requestStart,
               download: entry.responseEnd - entry.responseStart,
               total: entry.duration,
               // 大小信息
               transferSize: entry.transferSize || 0,
               encodedSize: entry.encodedBodySize || 0,
               decodedSize: entry.decodedBodySize || 0,
               // 附加信息
               startTime: entry.startTime,
               cached: entry.transferSize === 0 && entry.decodedBodySize > 0
            };
            
            this.resources.set(entry.name, analysis);
         }

         getTopSlow(count = 10) {
            return Array.from(this.resources.values())
               .sort((a, b) => b.total - a.total)
               .slice(0, count);
         }

         analyzeResourcesByType() {
            const stats = {};

            this.resources.forEach(entry => {
               const type = entry.type;
               if (!stats[type]) {
                  stats[type] = {
                     count: 0,
                     totalSize: 0,
                     totalTime: 0,
                     avgTime: 0
                  };
               }
               
               stats[type].count++;
               stats[type].totalSize += entry.transferSize || 0;
               stats[type].totalTime += entry.total;
               stats[type].avgTime = stats[type].totalTime / stats[type].count;
            });

            return stats;
         }

         updateUI() {
            // 更新概要部分
            const totalResources = this.resources.size;
            const totalSize = Array.from(this.resources.values()).reduce((sum, res) => sum + res.transferSize, 0) / 1024;
            const avgLoadTime = Array.from(this.resources.values()).reduce((sum, res) => sum + res.total, 0) / totalResources;
            
            document.getElementById('summary').innerHTML = `
               <p>总资源数: <strong>${totalResources}</strong></p>
               <p>总大小: <strong>${totalSize.toFixed(2)} KB</strong></p>
               <p>平均加载时间: <strong>${avgLoadTime.toFixed(2)} 毫秒</strong></p>
            `;

            // 更新资源类型统计
            const typeStats = this.analyzeResourcesByType();
            let typeHtml = '<table><tr><th>类型</th><th>数量</th><th>平均时间 (毫秒)</th><th>总大小 (KB)</th></tr>';
            
            for (const [type, stats] of Object.entries(typeStats)) {
               typeHtml += `
                  <tr>
                     <td>${type}</td>
                     <td>${stats.count}</td>
                     <td>${stats.avgTime.toFixed(2)}</td>
                     <td>${(stats.totalSize / 1024).toFixed(2)}</td>
                  </tr>
               `;
            }
            typeHtml += '</table>';
            document.getElementById('typeSummary').innerHTML = typeHtml;

            // 更新资源详情表格
            const tbody = document.querySelector('#resourceTable tbody');
            tbody.innerHTML = '';

            this.getTopSlow(100).forEach(resource => {
               const row = document.createElement('tr');
               
               // 根据加载时间确定颜色
               let speedClass = 'good';
               if (resource.total > 1000) {
                  speedClass = 'slow';
               } else if (resource.total > 300) {
                  speedClass = 'moderate';
               }

               // 创建简单的时间线可视化 - 改为百分比计算更好适应
               const dnsPercent = (resource.dns / resource.total) * 100;
               const tcpPercent = (resource.tcp / resource.total) * 100;
               const ttfbPercent = (resource.ttfb / resource.total) * 100; 
               const downloadPercent = (resource.download / resource.total) * 100;
               
               const timeline = `
                  <div class="timeline-container">
                     <div title="DNS: ${resource.dns.toFixed(1)}毫秒" style="position:absolute; left:0; height:100%; width:${dnsPercent}%; background:#FF9800;"></div>
                     <div title="TCP: ${resource.tcp.toFixed(1)}毫秒" style="position:absolute; left:${dnsPercent}%; height:100%; width:${tcpPercent}%; background:#2196F3;"></div>
                     <div title="TTFB: ${resource.ttfb.toFixed(1)}毫秒" style="position:absolute; left:${dnsPercent + tcpPercent}%; height:100%; width:${ttfbPercent}%; background:#9C27B0;"></div>
                     <div title="下载: ${resource.download.toFixed(1)}毫秒" style="position:absolute; left:${dnsPercent + tcpPercent + ttfbPercent}%; height:100%; width:${downloadPercent}%; background:#4CAF50;"></div>
                  </div>
               `;
               
               row.innerHTML = `
                  <td title="${resource.fullUrl}">${resource.name}</td>
                  <td>${resource.type}</td>
                  <td>${(resource.transferSize / 1024).toFixed(2)}</td>
                  <td class="${speedClass}">${resource.total.toFixed(1)}</td>
                  <td>${timeline}</td>
               `;
               
               tbody.appendChild(row);
            });
         }
      }

      // 页面加载时初始化监控器
      document.addEventListener('DOMContentLoaded', () => {
         const monitor = new ResourceMonitor();
         
         // 添加测试请求以监控API调用
         setTimeout(() => {
            fetch('https://jsonplaceholder.typicode.com/todos/1')
               .then(response => response.json())
               .then(json => console.log('API响应:', json));
         }, 1000);
         
         // 添加一个使用httpbin.org模拟延迟的请求示例
         setTimeout(() => {
            console.log('开始发送延迟请求...');
            fetch('https://httpbin.org/delay/2')
               .then(response => response.json())
               .then(json => console.log('延迟请求响应:', json))
               .catch(err => console.error('延迟请求错误:', err));
         }, 2000);
      });
   </script>
</body>
</html>

提示

对于跨域资源,如果服务器未设置 Timing-Allow-Origin 头,则只能获取到基本的时间信息,详细的网络时间(如DNS、TCP连接时间)将被屏蔽。

延伸阅读

如何监控卡顿?

答案

参考 google 设备刷新率说明 如果单帧的渲染时间超过设备的刷新率(例如 60Hz 刷新率对应每帧约 16.67ms)则定义为卡顿。

基于帧率的概念,可以采用 requestAnimationFrame 来监控卡顿。示例代码如下

let lastFrameTime = 0
let frameCount = 0
let jankCount = 0
function monitorFrame () {
const currentTime = performance.now()
const deltaTime = currentTime - lastFrameTime

if (deltaTime > 16.67) { // 假设60Hz刷新率
jankCount++
console.warn(`Jank detected! Frame took ${deltaTime.toFixed(2)}ms`)
}

frameCount++
lastFrameTime = currentTime

requestAnimationFrame(monitorFrame)
// 可以在这里输出当前帧率和卡顿次数
console.log('Frame Rate: ', (1000 / deltaTime).toFixed(2), 'FPS')
console.log('Jank Count: ', jankCount)
}
monitorFrame()
提示

注意这里只是针对刷新率是 60FPS 的设备,对于诸如 90Hz、120Hz 等高刷新率设备,需要根据实际的刷新率来调整判断卡顿的阈值。此外在实际的应用中还要考虑采样频率等问题、平滑数据等问题。

延伸阅读

如何统计页面的 long task ?

答案

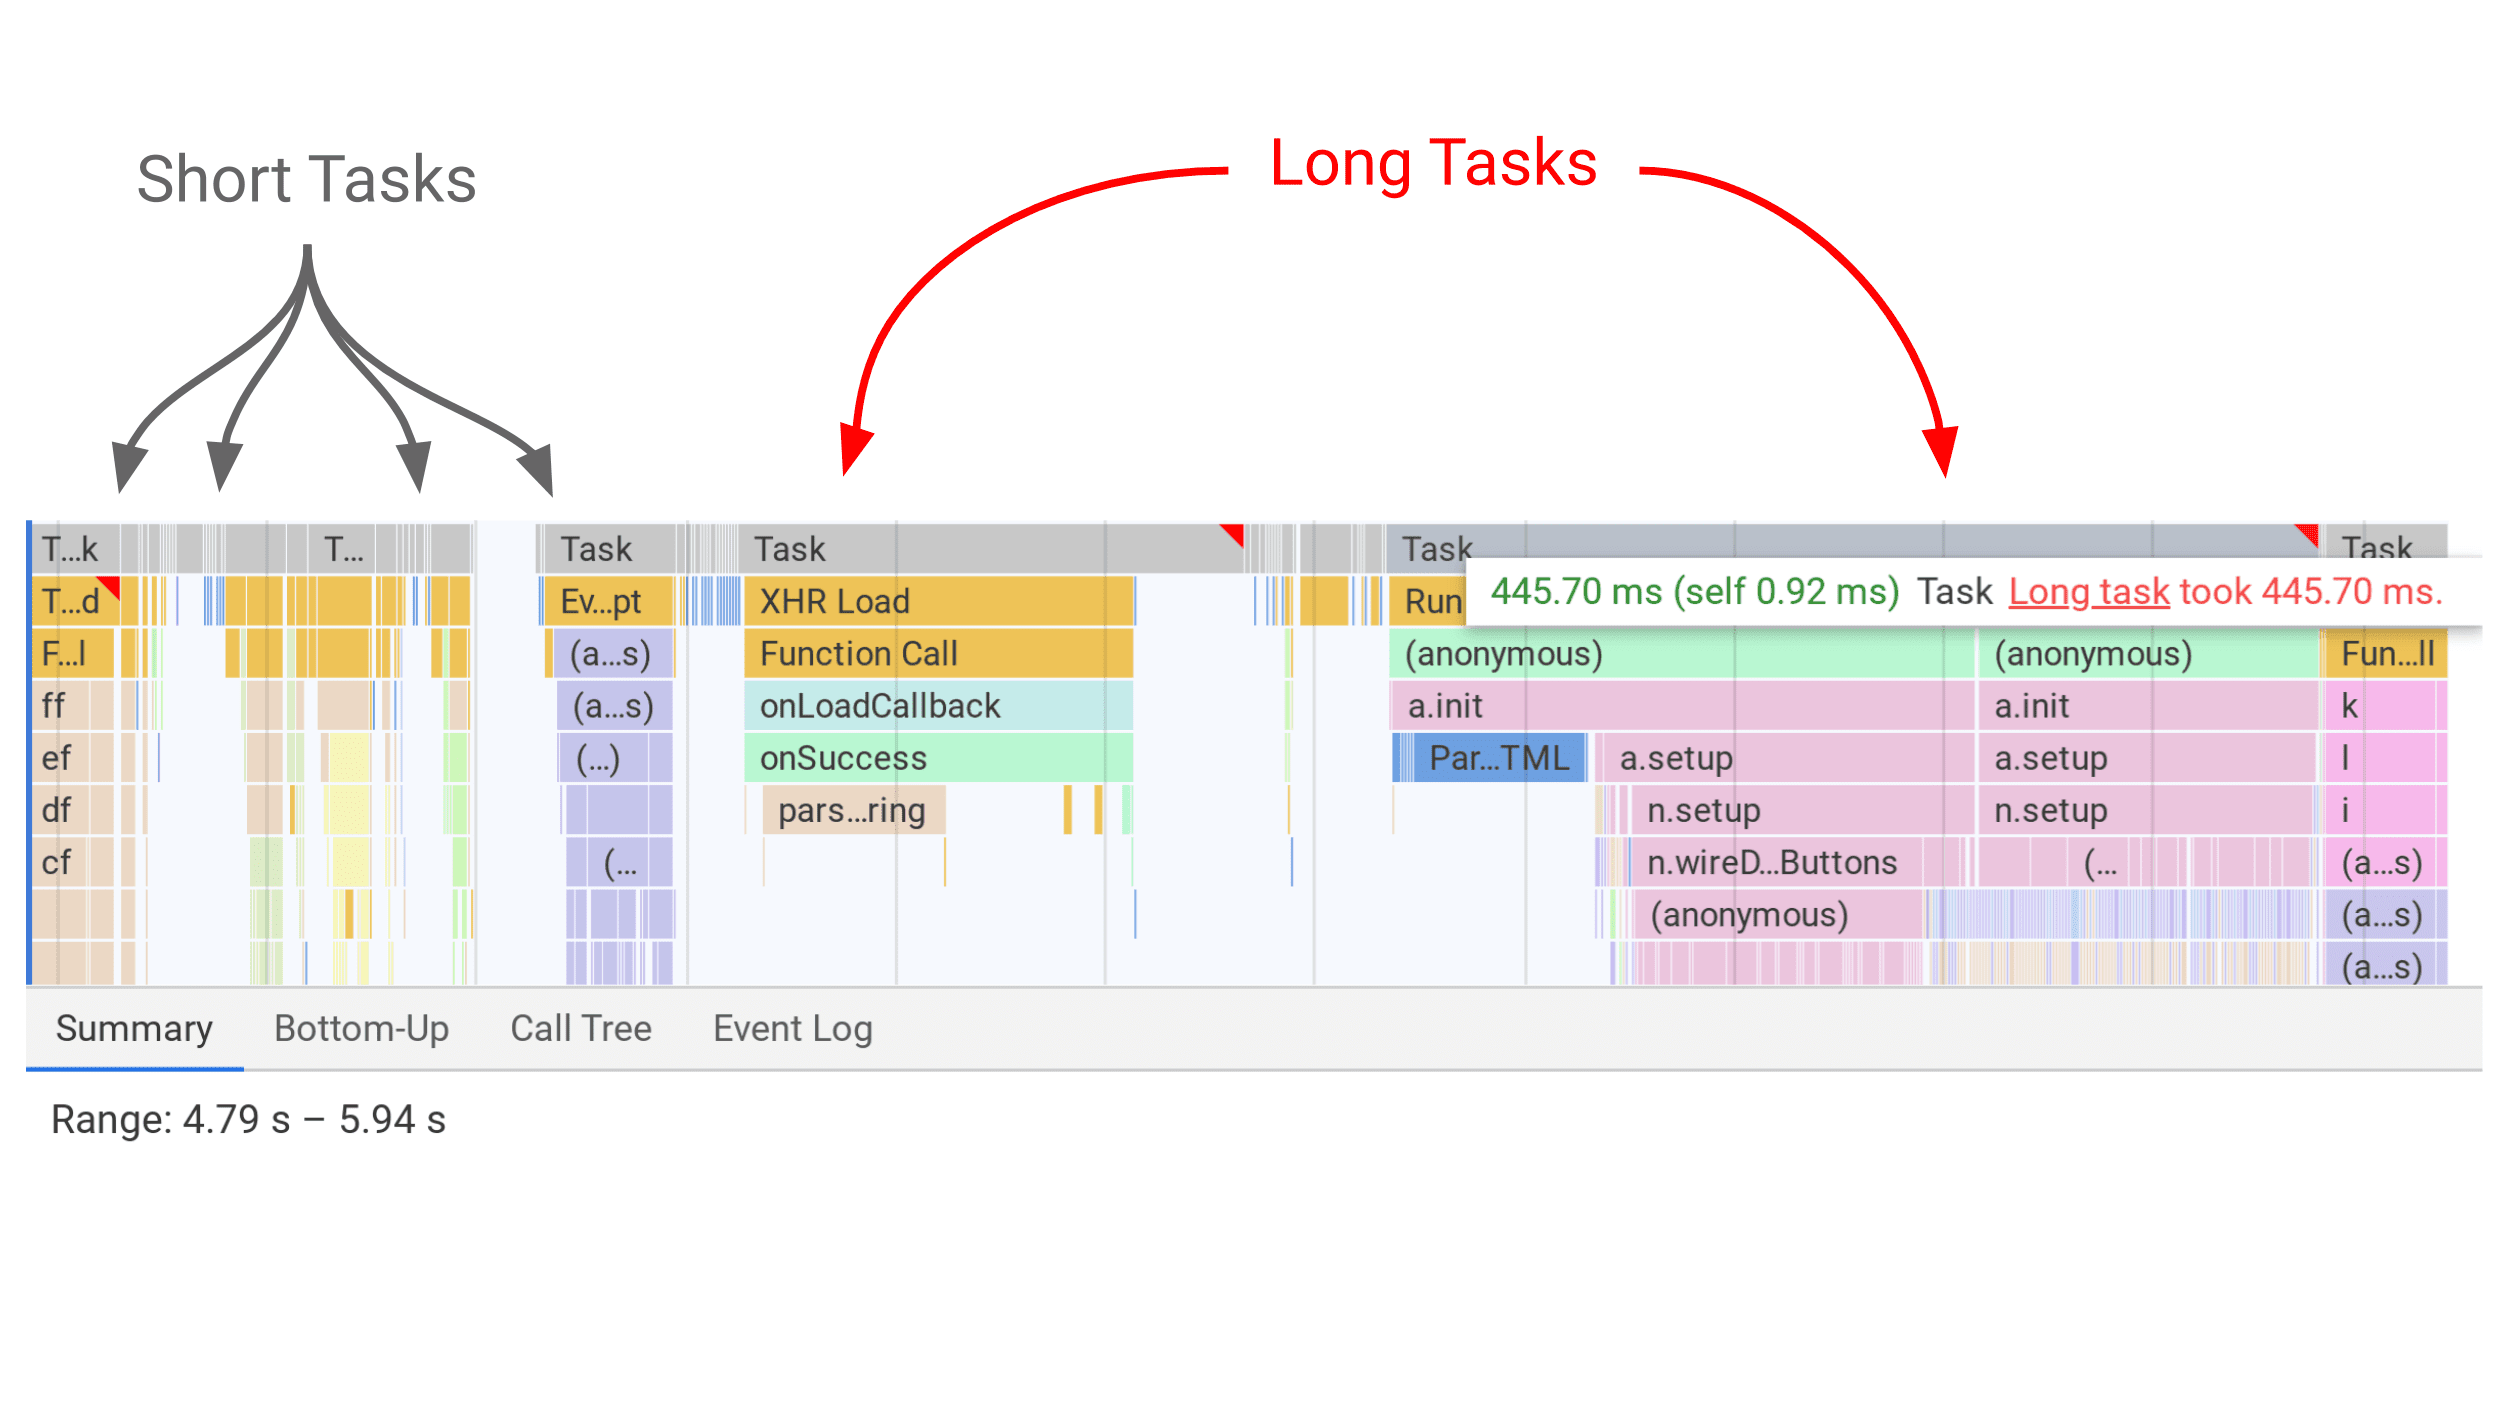
Long Task 是指在主线程上执行超过 50 毫秒的任务,chrome 会在性能面板对长任务打上红色标记

采用 PerformanceObserver, 通过 observer.observe({ entryTypes: ["longtask"] }); 监听长任务。

<!DOCTYPE html>
<html lang="zh">
<head>
   <meta charset="UTF-8">
   <meta name="viewport" content="width=device-width, initial-scale=1.0">
   <title>长任务检测演示</title>
   <style>
      body {
         font-family: Arial, sans-serif;
         max-width: 800px;
         margin: 0 auto;
         padding: 20px;
      }
      .container {
         border: 1px solid #ddd;
         padding: 20px;
         border-radius: 5px;
      }
      button {
         padding: 10px 15px;
         background-color: #4CAF50;
         color: white;
         border: none;
         border-radius: 4px;
         cursor: pointer;
         margin-right: 10px;
      }
      #results {
         background-color: #f9f9f9;
         padding: 10px;
         border-radius: 4px;
         min-height: 100px;
         margin-top: 20px;
      }
      .task-entry {
         border-bottom: 1px solid #ddd;
         padding: 5px 0;
      }
   </style>
</head>
<body>
   <h1>长任务检测演示</h1>
   
   <div class="container">
      <h2>什么是长任务?</h2>
      <p>长任务是指任何执行时间超过50毫秒的任务,它会阻塞主线程并可能导致UI卡顿。</p>
      
      <h2>亲自试试!</h2>
      <button id="createLongTask">创建长任务</button>
      <button id="clearResults">清除结果</button>
      
      <h3>检测到的长任务:</h3>
      <div id="results"></div>
   </div>

   <script>
      // 设置长任务观察器
      const observer = new PerformanceObserver((list) => {
         list.getEntries().forEach((entry) => {
            // 将长任务详情记录到控制台
            console.log('检测到长任务', entry);
            
            // 在页面上显示长任务详情
            const resultsDiv = document.getElementById('results');
            const taskDiv = document.createElement('div');
            taskDiv.className = 'task-entry';
            
            const duration = entry.duration.toFixed(2);
            const startTime = entry.startTime.toFixed(2);
            
            taskDiv.innerHTML = `
               <p><strong>检测到长任务:</strong></p>
               <p>持续时间: ${duration}毫秒</p>
               <p>开始时间: ${startTime}毫秒</p>
            `;
            
            resultsDiv.appendChild(taskDiv);
         });
      });
      
      // 注册观察器以接收长任务通知
      observer.observe({ entryTypes: ["longtask"] });
      
      // 创建长任务的按钮
      const LongTaskInterval = 51; // 设置一个 50 ms 的长任务
      document.getElementById('createLongTask').addEventListener('click', () => {
         // 执行一个会阻塞主线程的繁重计算
         const startTime = performance.now();
         
         // 这个循环将运行一段时间,阻塞主线程

         while (performance.now() - startTime < LongTaskInterval);

         const endTime = performance.now();
         console.log(`繁重计算耗时 ${(endTime - startTime).toFixed(2)}毫秒`);
      });
      
      // 清除结果的按钮
      document.getElementById('clearResults').addEventListener('click', () => {
         document.getElementById('results').innerHTML = '';
      });
   </script>
</body>
</html>
提示

注意 chrome 只会把在主线程持续执行时间大于 50ms 的任务统计为长任务,可以将示例中的 LongTaskInterval = 49 来验证此逻辑

对于长任务的优化通常通过将任务拆分为更小的子任务来实现,以减少单个任务的执行时间,从而避免长任务的出现。具体策略可以参考 优化耗时较长的任务

延伸阅读

如何实现自定义指标采集?

答案

自定义指标采集通过 Performance API 实现业务链路性能监控,主要使用 performance.mark()performance.measure() 进行精确测量。

方法功能使用场景数据获取
performance.mark()创建时间戳标记标记关键节点performance.getEntriesByName()
performance.measure()测量两点间耗时计算阶段耗时performance.getEntriesByName()
performance.now()获取高精度时间戳手动计时直接返回数值

参考示例

<!DOCTYPE html>
<html lang="en">
<head>
   <meta charset="UTF-8">
   <title>Custom Performance Metrics Demo</title>
   <style>
      body { font-family: sans-serif; max-width: 800px; margin: 0 auto; padding: 20px; }
      button { margin: 5px; padding: 8px 16px; }
      #results { margin-top: 20px; border: 1px solid #ddd; padding: 15px; }
      table { width: 100%; border-collapse: collapse; }
      th, td { border: 1px solid #ddd; padding: 8px; text-align: left; }
      th { background-color: #f2f2f2; }
   </style>
</head>
<body>
   <h1>自定义性能指标采集示例</h1>
   
   <div>
      <button id="loadData">加载数据</button>
      <button id="renderUI">渲染界面</button>
      <button id="processData">处理数据</button>
      <button id="viewMetrics">查看性能指标</button>
      <button id="clearMetrics">清除指标</button>
   </div>

   <div id="results">
      <h3>性能测量结果:</h3>
      <table id="metricsTable">
         <thead>
            <tr>
               <th>操作</th>
               <th>耗时 (ms)</th>
               <th>开始时间</th>
               <th>结束时间</th>
            </tr>
         </thead>
         <tbody><!-- 数据将被插入到这里 --></tbody>
      </table>
   </div>

   <script>
      // 设置 PerformanceObserver 自动收集测量结果
      const perfObserver = new PerformanceObserver((list) => {
         list.getEntries().forEach(entry => {
            if (entry.entryType === 'measure') {
               console.log(`[性能观察器] ${entry.name}: ${entry.duration.toFixed(2)}ms`);
            }
         });
      });
      perfObserver.observe({ entryTypes: ['measure'] });

      // 使用命名空间避免冲突
      const PERF_NS = 'app-metrics';

      // 自定义性能跟踪工具
      const PerformanceTracker = {
         start(operationName) {
            const markName = `${PERF_NS}.${operationName}.start`;
            performance.mark(markName);
            return markName;
         },
         
         end(operationName) {
            const startMark = `${PERF_NS}.${operationName}.start`;
            const endMark = `${PERF_NS}.${operationName}.end`;
            const measureName = `${PERF_NS}.${operationName}`;
            
            performance.mark(endMark);
            performance.measure(measureName, startMark, endMark);
            
            // 清理不再需要的标记
            performance.clearMarks(startMark);
            performance.clearMarks(endMark);
            
            return measureName;
         },
         
         getMeasurements() {
            return performance.getEntriesByType('measure')
               .filter(entry => entry.name.startsWith(PERF_NS));
         },
         
         clearMeasurements() {
            const measures = this.getMeasurements();
            measures.forEach(measure => {
               performance.clearMeasures(measure.name);
            });
         }
      };

      // 模拟API请求
      function simulateAPIRequest() {
         return new Promise(resolve => {
            setTimeout(() => {
               resolve({ data: [1, 2, 3, 4, 5] });
            }, Math.random() * 800 + 200);
         });
      }

      // 模拟操作
      async function loadData() {
         PerformanceTracker.start('data-loading');
         try {
            const result = await simulateAPIRequest();
            window.appData = result.data;
         } finally {
            PerformanceTracker.end('data-loading');
         }
      }

      function renderUI() {
         PerformanceTracker.start('ui-rendering');
         
         // 模拟UI渲染工作
         const start = performance.now();
         while (performance.now() - start < 150) { /* 模拟复杂渲染 */ }
         
         PerformanceTracker.end('ui-rendering');
      }

      function processData() {
         if (!window.appData) {
            alert('请先加载数据!');
            return;
         }
         
         PerformanceTracker.start('data-processing');
         const result = window.appData.map(x => x * x);
         console.log('处理后的数据:', result);
         PerformanceTracker.end('data-processing');
      }

      function updateMetricsTable() {
         const measurements = PerformanceTracker.getMeasurements();
         const tbody = document.querySelector('#metricsTable tbody');
         tbody.innerHTML = '';
         
         measurements.forEach(entry => {
            const row = document.createElement('tr');
            const operationName = entry.name.replace(`${PERF_NS}.`, '');
            
            row.innerHTML = `
               <td>${operationName}</td>
               <td>${entry.duration.toFixed(2)} ms</td>
               <td>${new Date(entry.startTime + performance.timeOrigin).toLocaleTimeString()}</td>
               <td>${new Date(entry.startTime + entry.duration + performance.timeOrigin).toLocaleTimeString()}</td>
            `;
            
            tbody.appendChild(row);
         });
      }

      // 事件监听
      document.getElementById('loadData').addEventListener('click', loadData);
      document.getElementById('renderUI').addEventListener('click', renderUI);
      document.getElementById('processData').addEventListener('click', processData);
      document.getElementById('viewMetrics').addEventListener('click', updateMetricsTable);
      document.getElementById('clearMetrics').addEventListener('click', () => {
         PerformanceTracker.clearMeasurements();
         updateMetricsTable();
      });
   </script>
</body>
</html>

实际开发要点

  • 及时清理性能条目避免内存泄漏,使用 performance.clearMarks()performance.clearMeasures()
  • 标记名称应具有唯一性,建议使用命名空间前缀
  • 高频操作谨慎使用,避免性能条目缓冲区溢出
  • 结合 PerformanceObserver 实现自动化数据收集
提示

自定义指标采集特别适合 SPA 应用的路由切换、组件渲染、API 请求等关键业务流程的性能监控。

延伸阅读

48%